The maximum likelihood estimator (MLE) of the logistic regression model is not an unbiased estimator. Therefore, estimates calculated with glm() contain bias. Since the MLE satisfies consistency and asymptotic normality, the bias can be disregarded when the sample size is large. However, in the analysis of high-dimensional data, the sample size is sometimes relatively small compared to the dimension of input variables.
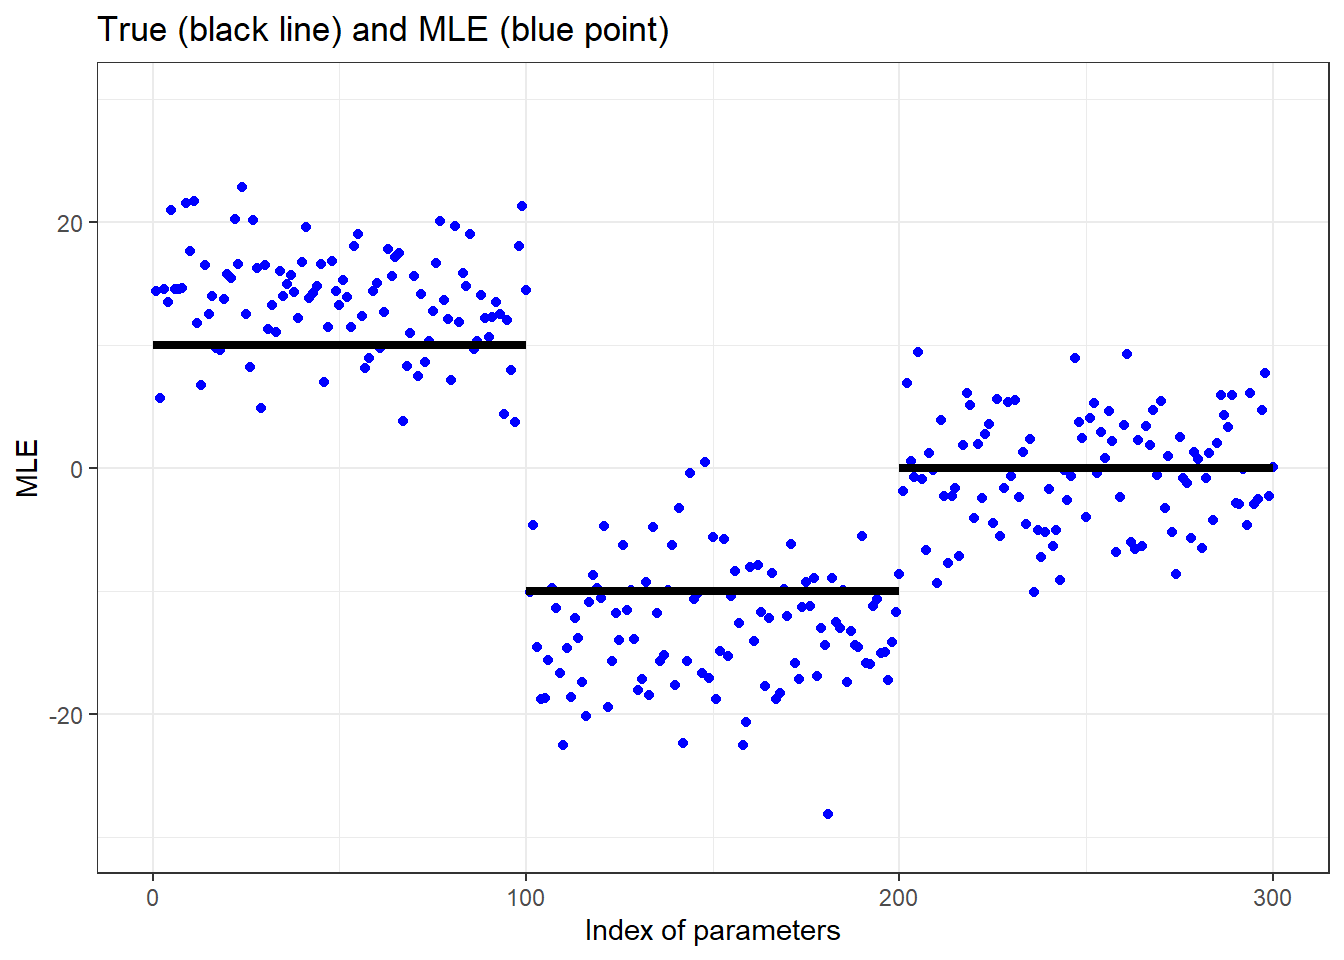
For example, let’s consider a scenario where the number of input variables p = 300, and the sample size n = 2000. Additionally, the true parameters beta consist of
beta = 10 for the first 1/3,
beta = -10 for the next 1/3, and
beta = 0 for the remaining 1/3.
In such a case, the MLE returned by glm() contains a non-negligible bias.
p <-300n <-2000set.seed(314)x <-rnorm(n * p, mean =0, sd =sqrt(1/n))X <-matrix(x, nrow = n, ncol = p)beta <-matrix(rep(c(10, -10, 0), each = p/3), nrow = p, ncol =1)prob <-plogis(X %*% beta)y <-rbinom(n, 1, prob)fit <-glm(y ~ X, family = binomial, x =TRUE)library(ggplot2)theme_set(theme_bw())df <-data.frame(index =seq_len(p), mle =coef(fit)[-1])ggplot(df, aes(index, mle)) +geom_point(color ="blue") +annotate("segment", x =c(0, 100, 200), xend =c(100, 200, 300), y =c(10, -10, 0), yend =c(10, -10, 0), linewidth =1.5) +scale_x_continuous(breaks =c(0, 100, 200, 300)) +ylim(-30, 30) +xlab("Index of parameters") +ylab("MLE") +ggtitle("True (black line) and MLE (blue point)")
You can see that the blue points (MLE) are significantly outside the perimeter of the black line (true).
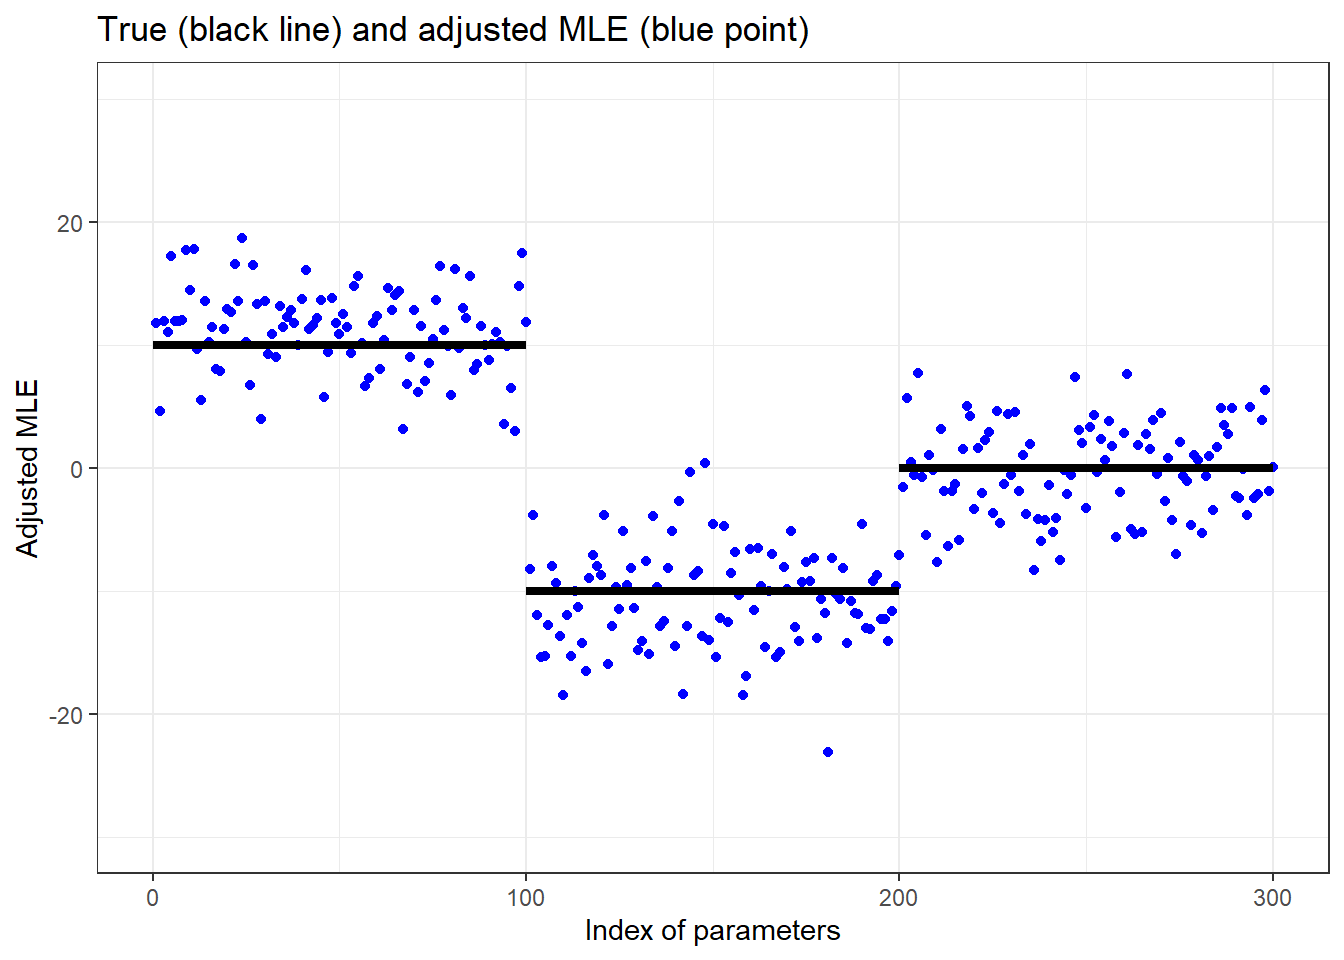
The purpose of this package is to alleviate the bias by adjusting the MLE. To achieve this, we implemented two methods:
“ProbeFrontier,” as proposed by Sur and Candès (2018), and
“SLOE,” as proposed by Yadlowsky et al. (2021).
The adjustMLE function in our package is designed to mitigate this bias.
install.packages("remotes") # if you have not installed "remotes" packageremotes::install_github("hoxo-m/adjustMLE")
References
Sur, P., & Candès, E.J. (2018). A modern maximum-likelihood theory for high-dimensional logistic regression. Proceedings of the National Academy of Sciences of the United States of America, 116, 14516 - 14525.
Yadlowsky, S., Yun, T., McLean, C.Y., & D’Amour, A. (2021). SLOE: A Faster Method for Statistical Inference in High-Dimensional Logistic Regression. Neural Information Processing Systems.